Section 4. DRAKON - Visual Algorithmic Language
This section explores the application of DrakonTech, a visual programming technology, to the design and implementation of data structures and algorithms. We will demonstrate how DrakonTech’s graphical approach simplifies the representation of complex algorithmic logic, making it easier to understand, develop, and maintain efficient data structures and algorithms. We will cover the core principles of DrakonTech and illustrate its use in solving common algorithmic challenges, emphasizing its ability to enhance code clarity and reduce errors.
4.1. Algorithm Representation Visualization
4.1.1. Methods of Visualization of Algorithms
In theory and practice, the following forms of representation of algorithms have been formed:
-
Words (written in natural language)
-
Visual (images from graphic characters)
-
Pseudocode (semiformalized descriptions of algorithms in conditional algorithmic language)
-
Software (programming language texts)
Visual representations of algorithms were the most effective and common in terms of visualization and understanding. Conceptually, visualization is a form of presentation of information, data, and knowledge in the form of images, in order to achieve maximum convenience of perception, understanding, and analysis. Visual representation allows a better view and understanding of the structural elements used in the design of the algorithm, including the logic of their interaction.
The most common means of visualizing algorithmic constructions are flowcharts and Drakon-diagrams. The advantage of flowcharts is the availability of a corresponding State standard. However, flowcharts have recently been criticized: they are unsuitable for structural programming, difficult to formalize, and cannot be used to generate programming code.
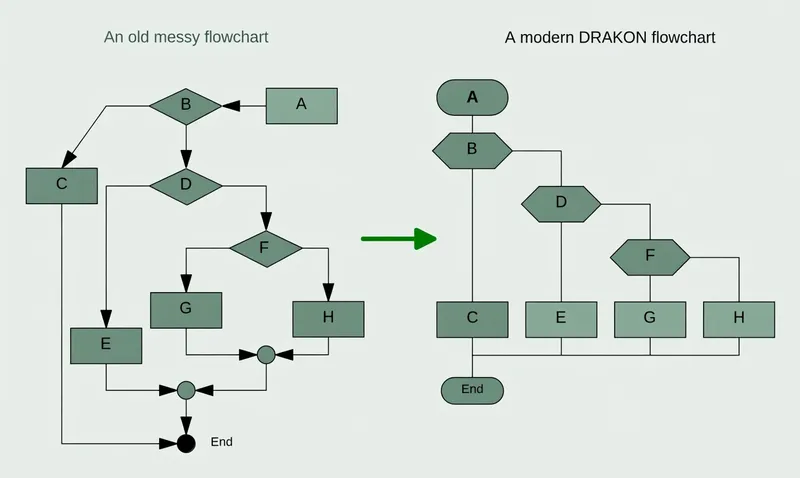
An alternative to flowchart imaging is Drakon-based algorithm engineering, which results in Drakon-diagrams. Drakon-diagrams are suitable for formalized recording, automatic code retrieval, and execution on a computer. However, a more important aspect of Drakon-technology is its cognitive difference from flowchart technology. While flowcharts do improve program clarity, this is not always the case, and improvements are limited. In addition, there are many cases where unsuccessful flowcharts confuse the case and make understanding difficult. In contrast, Drakon-diagrams are much better understood (Figure 4.1).
4.1.2. Algorithmic Language Drakon
DrakonTech is a visual programming language with a strong emphasis on clarity and understandability, which makes it particularly well-suited for developing algorithmic thinking. Here is a breakdown of its purpose and potential.
-
Improving Algorithm Comprehension: Drakon technology uses visual diagrams to represent algorithms, making them easier to grasp than traditional text-based code. This visual approach helps to clarify the flow of logic and the relationships between different parts of an algorithm.
-
Enhancing Communication: The standardized visual language facilitates communication between developers, as well as between developers and non-technical stakeholders. This is especially valuable in complex projects where clear communication is essential.
-
Increasing Software Reliability: By promoting clear and structured algorithms, Drakon technology helps to reduce errors and improve the reliability of software. This is particularly important in critical applications, such as those in aerospace or medical fields.
-
Facilitating Learning: Drakon technology serves as an excellent tool for teaching and learning programming concepts, as it helps to visualize abstract ideas.
Potential for Developing Algorithmic Thinking:
-
Visualizing Logic: The visual nature of DrakonTech allows users to see the logical flow of an algorithm, which helps to develop their ability to think logically and systematically.
-
Structuring Problems: Drakon-technology encourages users to break down complex problems into smaller, more manageable steps, which is a fundamental aspect of algorithmic thinking.
-
Identifying Patterns: By visualizing algorithms, users can more easily identify patterns and recurring structures, which can lead to more efficient and elegant solutions.
-
Debugging and Problem-Solving: The visual representation of algorithms makes it easier to identify and correct errors, which helps to develop problem-solving skills.
-
Abstraction: Drakon helps to teach abstraction by allowing people to look at the overall flow of a process without necessarily having to focus on the small granular details of every step.
In essence, Drakon-technology’s strength lies in its ability to bridge the gap between abstract algorithmic concepts and concrete visual representations. This makes it a valuable tool for anyone seeking to develop their algorithmic thinking skills.
4.1.3. DrakonTech - JavaScript Implementation of Drakon Technology
Visual Development with Flowcharts: DrakonTech allows you to build programs by creating flowcharts. Each flowchart becomes a JavaScript function. This visual approach ensures you can still understand your program even years later.
Readable and Standardized Diagrams: Drakon flowcharts are based on a strict aerospace-industry standard that ensures your diagrams are clean, consistent, and free of visual noise. You do not need to know the standard—DrakonTech automatically ensures your diagrams adhere to it.
Intuitive and Efficient Editing: Forget traditional, cumbersome diagramming software. With DrakonTech, creating and modifying flowcharts is quick and easy. A few clicks are all it takes to build even the most advanced algorithms.
Advanced Features for Modern Development: DrakonTech’s code generator supports:
-
Modules
-
Functions
-
Object-oriented programming
-
Finite automata (finite-state machines)
-
Backward chaining
4.2. Interface of DrakonTech
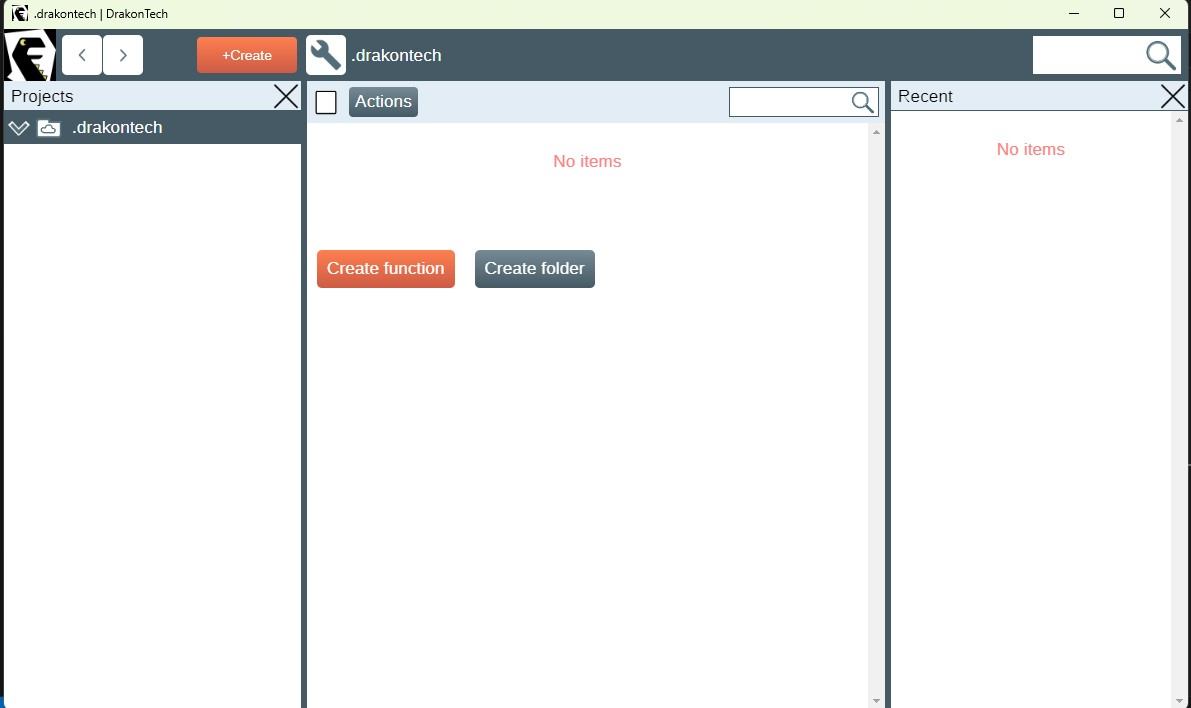
The interface of DrakonTech is designed with a focus on visual clarity and ease of use. Here is a general overview (Figure 4.2):
4.2.1. Core Principles
-
Visual Flow: The primary focus is on a graphical workspace where users construct algorithms using visual icons and connecting lines. This emphasizes the flow of control and data.
-
Simplified Icons: Drakon-technology uses a limited set of standardized icons, each representing a specific action or decision. This keeps the diagrams clean and easy to interpret.
-
Structured Layout: The language enforces a structured layout, which helps to maintain consistency and readability. This is a key feature that distinguishes Drakon-technology from free-form flowcharting tools.
4.2.2. Typical Interface Elements
-
Canvas/Workspace: This is the central area where users create and edit Drakon diagrams. Users can drag and drop icons, connect them with lines, and add text labels.
-
Icon Palette/Toolbar: This provides access to the various Drakon icons, such as:
-
Start and end points
-
Action boxes
-
Decision diamonds
-
Loop structures
-
-
Properties/Inspector Panel: This panel allows users to modify the properties of selected icons, such as:
-
Text labels
-
Conditions for decision points
-
Data values
-
-
Code Generation/Output Panel: In DrakonTech, which is designed for code generation, this area displays the generated code in the target programming language (e.g., JavaScript).
-
Navigation and Zoom Controls: These allow users to navigate large diagrams and zoom in or out for detailed editing.
Key Characteristics:
-
Clarity: The interface is designed to minimize visual clutter and maximize the clarity of the algorithm.
-
Efficiency: The tools and layout are optimized for efficient diagram creation and editing.
-
Standardization: The interface adheres to the Drakon language’s standards, ensuring consistent and understandable diagrams.
In summary, the DrakonTech interface prioritizes visual communication and structured algorithm representation, making it a valuable tool for both programming and conceptual understanding of complex logical workflows.
4.3. Creating a Drakon-Diagram
The web application DrakonTech provides for the creation of two types of Drakon-diagrams; the choice is determined by the complexity of the algorithm (Figure 4.3):
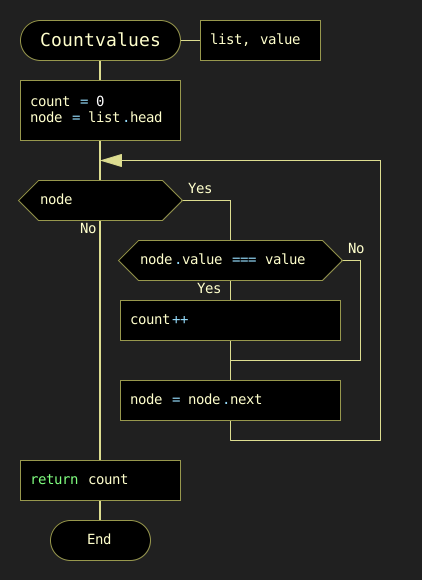
a) Primitive
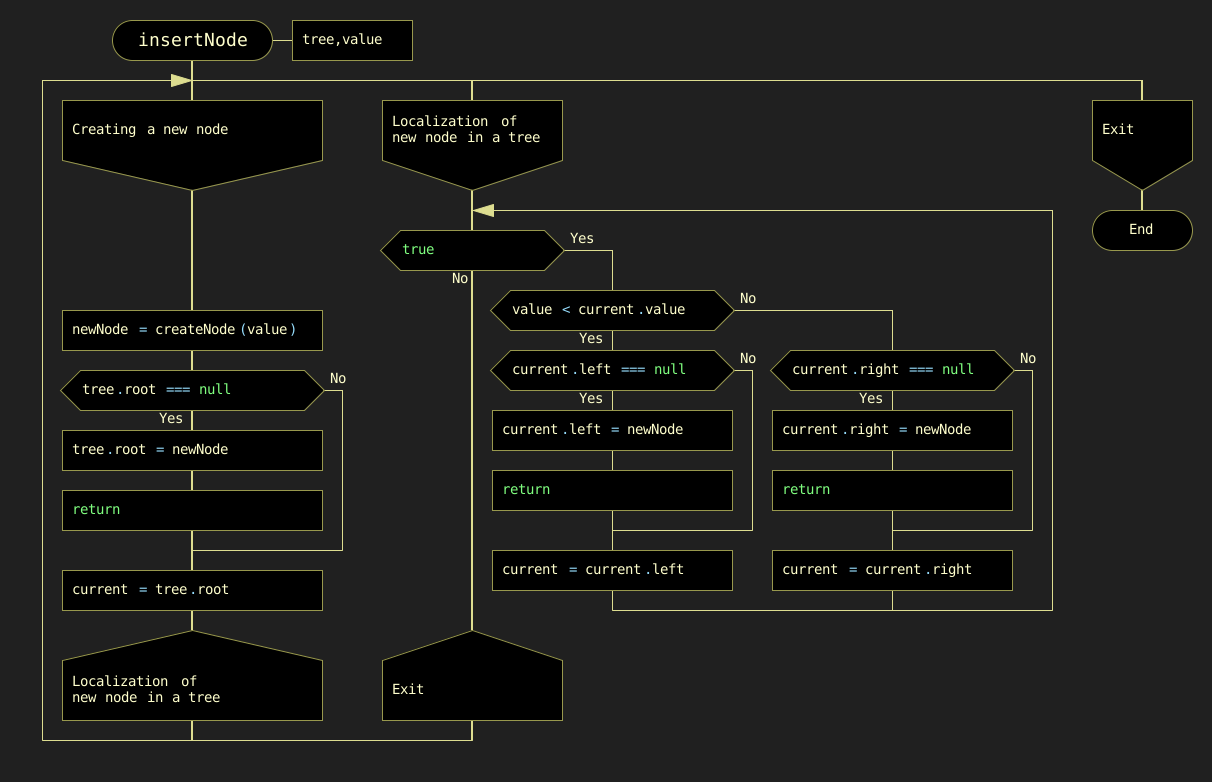
b) Silhouette
To create a Drakon-diagram, the user chooses the necessary icons, filling them with the corresponding operators of the JavaScript programming language (Figure 4.4).
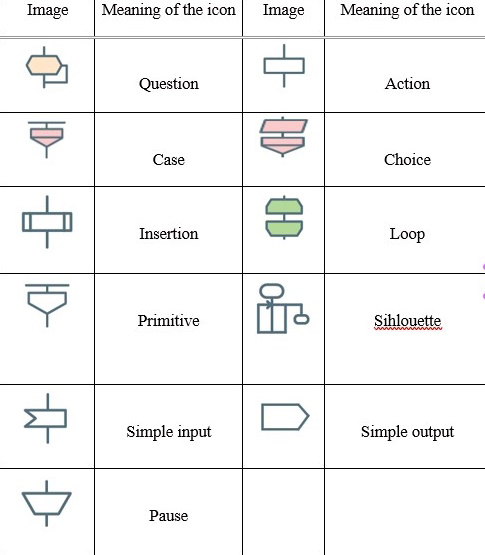
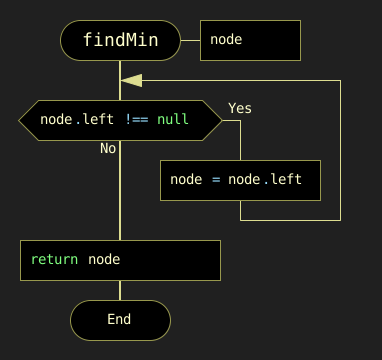
Creating a Drakon-diagram must follow certain rules. The selected icon is moved by the mouse to the vertical line (skewer in Drakon technology terms) in the right place. Creating a Drakon-diagram must follow certain rules:
-
Creating a Drakon-diagram begins with a name that should reflect the purpose of the algorithm (function) and be located at the top.
-
The diagram should have only one beginning and one end. The "end" graph is placed at the bottom of the diagram (Figure 4.5):
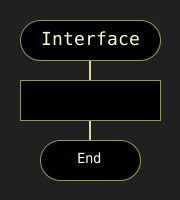
The action flow represented in the diagram should only go from top to bottom. This approach is more convenient because in our cultural area texts are read in this way: from top to bottom. The top-down flow of actions is a fundamental principle of Drakon technology, which ensures that the algorithm’s logic is easy to follow and understand.
-
Avoid turning. The only case where lines have to change direction is where decisions are made. Turns are needed only when the algorithm requires making a choice between different actions. If there are no decisions, you need to go down. In any case, it is necessary to minimize the number of turns.
-
Crossings of lines are absolutely not allowed. All attempts to apply crossings must be prevented. However, in case of an intersection, the editor will give an error.
-
A top-down action prevents the use of arrows. The only exception is a while loop (Figure 4.6):
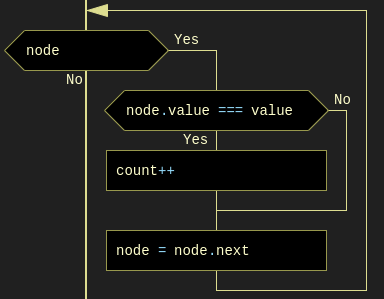
When creating a Drakon-diagram, only straight vertical and horizontal lines should be used, as straight lines are easier to understand than curves.
The distance between icons is set automatically.
Branching is done only to the right. Branching to the left should be excluded. Following this rule significantly increases the predictability and uniformity of charts.
For convenience, the Drakon diagram can be moved around the work area using Shift + mouse wheel (horizontally) and using the mouse wheel (vertically).
The reader may get the impression that creating Drakon-diagrams is a very complex process. It should be recalled once again that in the DrakonTech editor everything is quite simple and clear. The editor will not allow the violation of the stated rules, which is checked by the verify option.
4.4. Basic Structures of Drakon Algorithms
4.4.1. Linear Structure
The linear structure of an algorithmic process implements operations that are performed sequentially in order of writing. A typical example of such a process is a standard three-step computing scheme:
a) Input data b) Formula calculation c) Output result
The graphical representation of the basic element of the linear structure in JavaScript is in the form of simple rectangles (Figure 4.7).
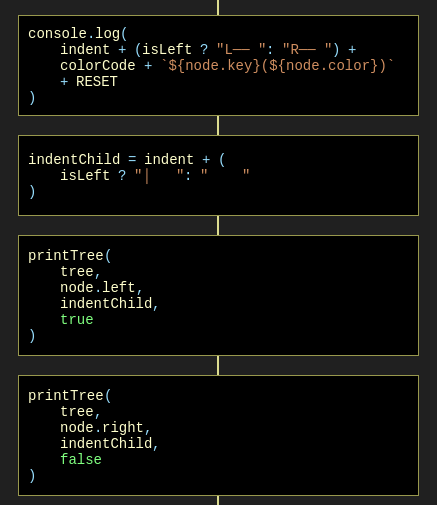
4.4.2. Basic Structures of Branched Structure
The branched structure contains at least one condition check, which ensures the transition to one of the possible solutions. Each option leads to a common output; that is, the algorithm will continue regardless of which path is chosen. The branching structure exists in two main options:
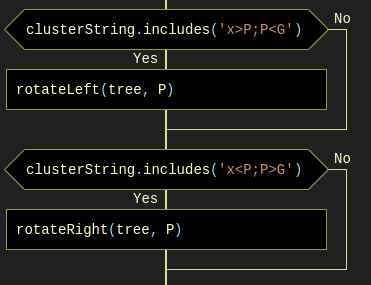
a) if-else Construction
The Drakon snippet of the construction "if (condition), then (action) otherwise (action)" corresponds in programming languages to the if…else statement. An example of an if-else construction in a Drakon-diagram in an algorithm for finding minimum and maximum array values (Figure 4.8):
if-else Constructionb) Select Construction (Switch Statement)
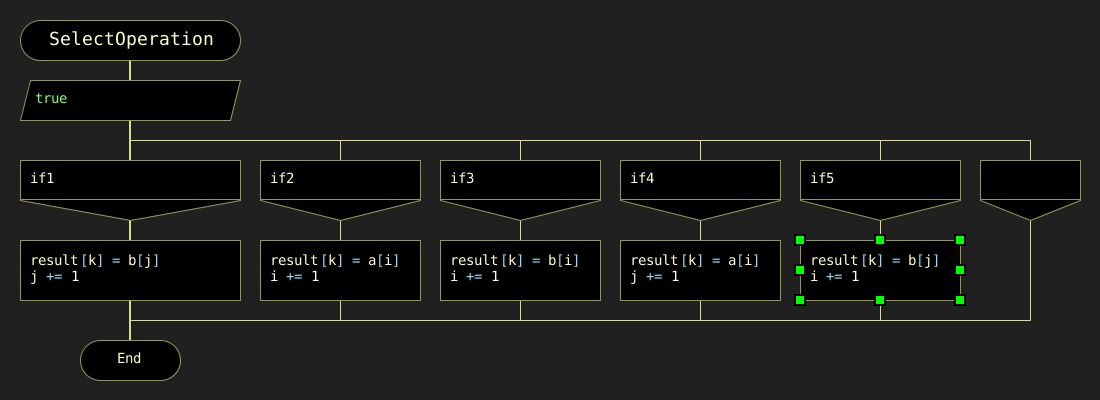
The values to which the expression in the "Choose" graph will be compared are covered in the "Option" graphs. If there is no text in the extreme right, it means "all other values". Below is an example of how to branch a sorting algorithm (merge sort) (Figure 4.9).
4.4.3. Basic Loop Constructions
The loop structure involves repeating the same sequence of actions repeatedly. The number of repetitions is determined by the input data or task conditions. Loop structures include, first of all, the construction "Loop-For" (C-style loop), "Loop for each", composite constructions "Loop-With-Arrow" ("Do-Check loop"), and "Do-Check-Do".
a) Loop-For Construction
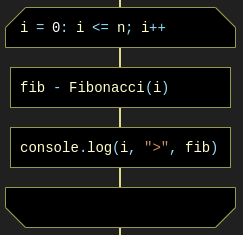
"Loop-For" consists of three parts. In the first part, the loop initialization is fixed. In the second, the loop completion condition is checked. If true, the body operators of the loop are executed until the expression becomes false. If false, the loop ends and control is passed to the next operator. In the third part, the loop parameter increases. The snippet of the Drakon-diagram with the "Loop-For" design has the appearance shown in Figure 4.10:
b) Loop for each Construction
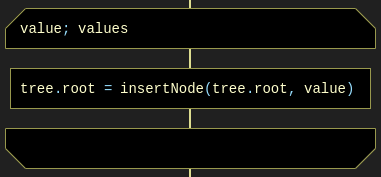
The "foreach" loop executes the operator or block of operators for each array element or data list (Figure 4.11):
c) Loop With Arrow Construction
An example of a composite construction "Loop With Arrow" (Figure 4.12):
4.5. From Drakon-Diagram to Program Code
Each Drakon-diagram corresponds to a program module. Figure 4.13 shows the structure of the array sorting algorithm consisting of a series of separate modules (Drakon-diagrams) and the main Drakon-diagram containing the main program’s main design.
Let us create a Drakon-diagram using the example of a program for determining the digital root. The digital root of a non-negative integer is the single-digit value obtained by repeatedly summing the digits of the number. This process continues until the result is a single digit.
For example, let us take the number 12345:
-
First sum = 1 + 2 + 3 + 4 + 5 = 15
-
Second sum = 1 + 5 = 6
-
Therefore, the digital root of 12345 is 6.
To solve the problem of finding the digital root of an integer, we will create four Drakon-diagrams: module, main, digRoot, and sumDigits (Figure 4.13).
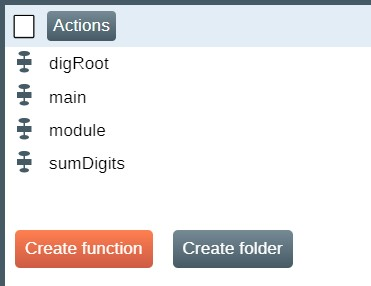
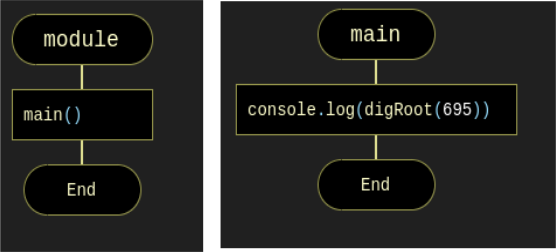
module, main, digRoot, and sumDigitsThe function module contains a call to the main() function. The main() function contains a call to the digroot function with an integer specified (Figure 4.14):
module and mainThe purpose of the function digRoot(n) is to organize a call to the function sumDigits(n) that calculates the sum of the digits of a given number. In turn, the sumDigits(n) function splits the string "12345" into individual characters, after which the sum of the corresponding integers converted by the parseInt(digit, 10) function is calculated in a loop (Figure 4.15).
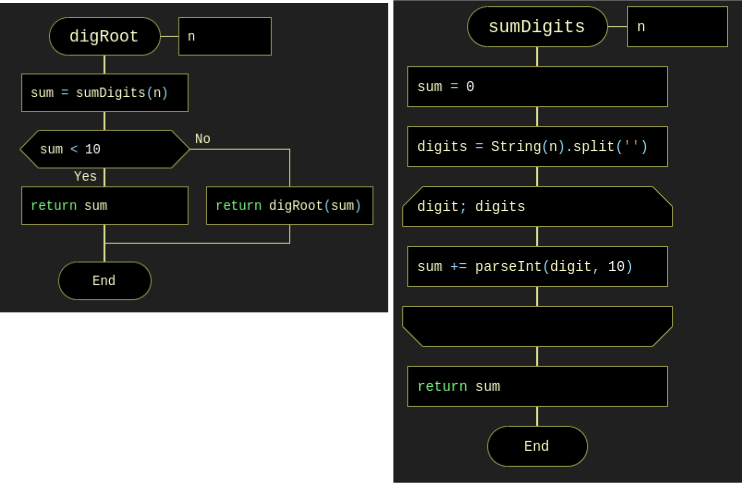
After creating the Drakon diagrams, the program code for determining the digital root in JavaScript is automatically generated by activating the "wrench" icon (Figure 4.16).

The result of automatic code generation in JavaScript:
main();
function digRoot(n) {
var sum;
sum = sumDigits(n);
if (sum < 10) {
return sum;
} else {
return digRoot(sum);
}
}
function main() {
console.log(digRoot(695));
}
function sumDigits(n) {
var digit, digits, sum;
sum = 0;
digits = String(n).split('');
for (digit of digits) {
sum += parseInt(digit, 10);
}
return sum;
}
4.6. Execution of the Generated Code
The generated code can be opened in one of the integrated development environments (IDE): Visual Studio Code, VIM, Eclipse, Atom, Sublime Text, and a number of others. This book uses the IDE Visual Studio Code (VSC), the description of which is not included here.
The execution of the generated program in the VS Code environment is carried out using the command: node ProgramName.js. Node.js is a JavaScript runtime environment that allows you to run JavaScript code outside of the browser. Node.js extends the capabilities of JavaScript, allowing it to create various tools and applications. The installer of Node.js is on the site nodejs.org. The generated program is launched via the terminal (Ctrl + `) or View → Terminal.
As part of the hybrid approach, debugging a program often has to be carried out in parallel in two environments: DrakonTech and Visual Studio Code. Naturally, in case of graphical syntax errors, Drakon-diagram code generation will not be performed.
The debugging process of the generated code is recommended to be carried out with the help of the appropriate programming environment toolkit. After debugging is complete, all corrections must be made to the corresponding graphs in the Drakon-diagram. In any case, it is always necessary to ensure that the contents of the diagrams correspond to the program code in the relevant IDE.
4.7. Summary
This section explored the fundamentals and practical applications of the DRAKON visual algorithmic language and the DrakonTech environment within our hybrid development workflow.
By translating complex algorithmic logic into structured visual diagrams, DRAKON eliminates ambiguity and significantly reduces cognitive overhead during algorithm design. We examined the key visual primitives, syntax rules, and architectural patterns (such as primitive and silhouette algorithms) that guarantee deterministic flow control. Furthermore, we demonstrated how DrakonTech automates the generation of clean, executable JavaScript code, seamlessly bridging high-level algorithmic concepts with runtime execution in Node.js and Visual Studio Code.
Mastering this visual approach equips developers and students with a disciplined method for designing, verifying, and debugging algorithms visually before and alongside traditional code editing.